VISUALIZATION perspectives
Complexity metrics are well-known but poorly applied. Lattice dependency matrices are obscure.
Used effectively together, they lead to valuable insights that reduce support costs and facilitate modernization.
- Click to Enlarge Complete Diagram
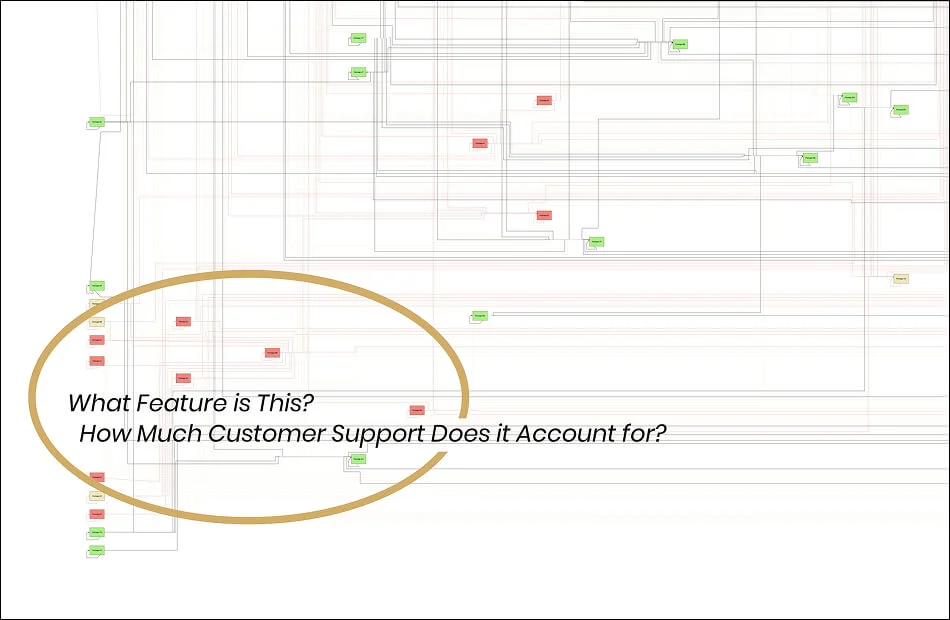
Your systems are too complex to see details in a single image. But the high-level view can act like an MRI, revealing concentrations of risk that can be addressed by rewriting a single subsystem.
Not all code ages gracefully. As systems evolve, they invariably become more complex, and code debt tends to accumulate. Massive data pools can seem unmanageable. But systems don’t have to be abandoned just because they’ve aged. Transform and modernize your maintenance nightmare strategically to achieve your objectives incrementally and with lower upfront investment.
ArkTech Perspectives provides consulting services to analyze your code and/or data models to produce color-coded software architecture visualizations that identify hot spots in the system, both for architectural weakness and for concentrations of high complexity.
These visualizations can be correlated with support logs, testing results, and frequency of code changes to guide decisions about which portions of the system to rewrite, which to discard, and which to maintain
If your organization is struggling to manage a maintenance nightmare, software architecture visualizations from ArkTech Perspectives may be the GPS for your modernization efforts to maximize the ROI in your existing systems.
Contact us today to discuss how we can help.
We start with a free 30-minute webconference to discuss your current challenges and key objectives. One of the outcomes of this call will be a list of questions we’ll need answered in order to prepare a proposal.
Once we have those answers, we will present our proposed services, tailored to your needs, on a second 30-minute webconference, and work with you to define the product success criteria. The project success criteria will be incorporated as a Work Schedule on a Services Agreement.
Work is typically performed on an hourly rate basis, with any cap on hours specified in the Work Schedule.
Complexity is more than just a number
As Manager of Development for McCabe & Associates, Jonathan Crawford, Founder, led development of the first suite of tools for visualizing cyclomatic complexity. And he applied those tools to yield hard, bottom-line results for organizations like Mentor Graphics, Teradata, and Sandia National Laboratories.
Software and data have an architecture, even when it’s not explicitly known
Jonathan used lattice dependency matrix (LDM) tools like Lattix to refactor an SQL-based system with over 250,000 lines of SQL, operating on a normalized database of over 500 tables. The resulting architectural visualizations guided changes that improved deployment time, provided a strategy for surfacing a set of microservices, and dramatically reduced the learning curve for new engineers – a critical success factor as resources were shifted offshore.
Effective software architecture visualization is a passion of Jonathan’s. When tools have limitations, he finds ways to work around those limitations, often resulting in new opportunities to apply those tools and new insights.